Looking at the continuation of the bond vigilantes rampage in the fixed income space in general and US Treasuries in particular with a poor auction taking place in the 30 year space with big banks having to buy more than 18% of the issuance instead of the usual 11%, as well as with the ruction in selecting a new speaker of the house (SOTH) for the US Congress, when it came to selecting our title analogy we decided to continue with our “pre-revolutionary” mindset and as such went for “Springtime of Nations”. In similar fashion that the French revolution of 1789 had a significant impact on the rest of Europe, the troubles of France of February 1848 had much more of an impact, sparking in effect a revolutionary wave known as the Revolutions of 1848 also known as “Springtime of Nations”. The “Springtime of Nations” which lasted from 1848 until 1849 remains the most widespread revolutionary wave in European history to date. As such one could opine that what started in the US fixed income space when it comes to “bond vigilantes” has no doubt spread onto other large part of the bond space with the famous infamous German Bund – Italian BTP spread flirting again with the 200 bps level but we ramble again…
In this conversation we would like to look at the start of the contagion in the credit space and what the China “Lehman” narrative entails from a contrarian perspective.
Macronomics Newsletter is a reader-supported publication. To receive new posts and support my work, consider becoming a free or paid subscriber.
Synopsis:
Cracks in credit?
Get to the chopper?
· Cracks in credit?
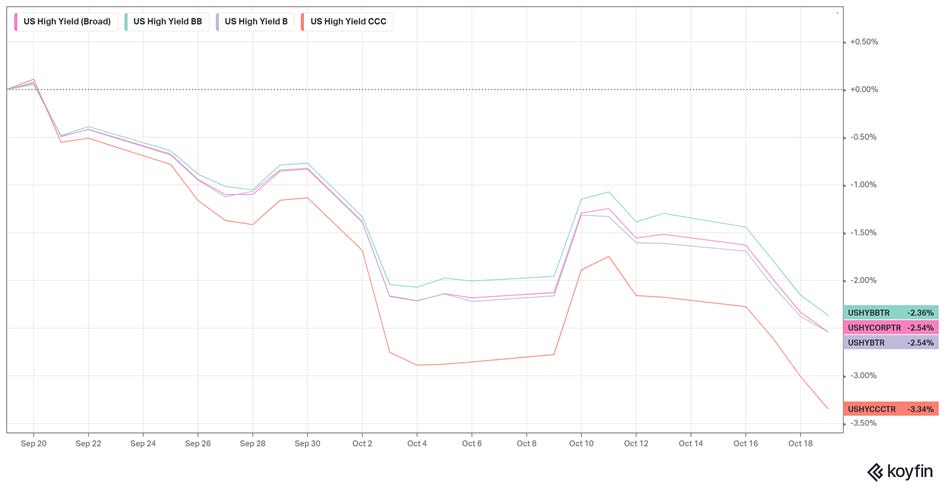
Following the continued acceleration in rising yields in conjunction with weakness in risky asset prices in general and equities markets in particular, validating in effect our the last point of our previous conversation “Vendémiaire” entitled the “fall in the fall”, we are starting to see “cracks in credit”.
We are seeing a weakening tone in US High Yield (1 month chart):
- Graph source Macronomics - KOYFIN
Bloomberg as well points towards a similar weakness in credit markets:
- Graph source Bloomberg
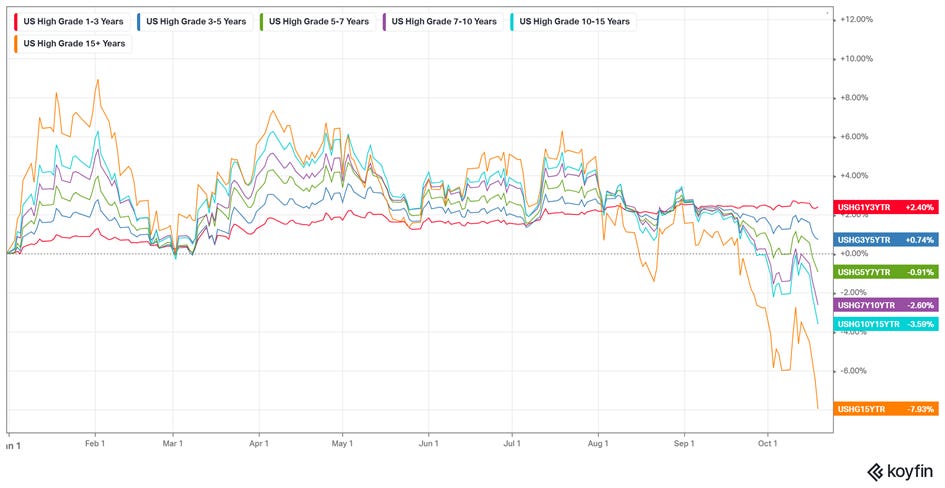
Of course as we pointed out in our last conversation Convexity is indeed starting to bite in US Investment Grade:
- Graph source Macronomics – KOYFIN
In terms of US Investment Grade, in similar fashion to US High Yield, the acceleration in the sell-off has started at the beginning of the Month during “Vendémiaire” period (1 month chart):
- Graph source Macronomics - KOYFIN
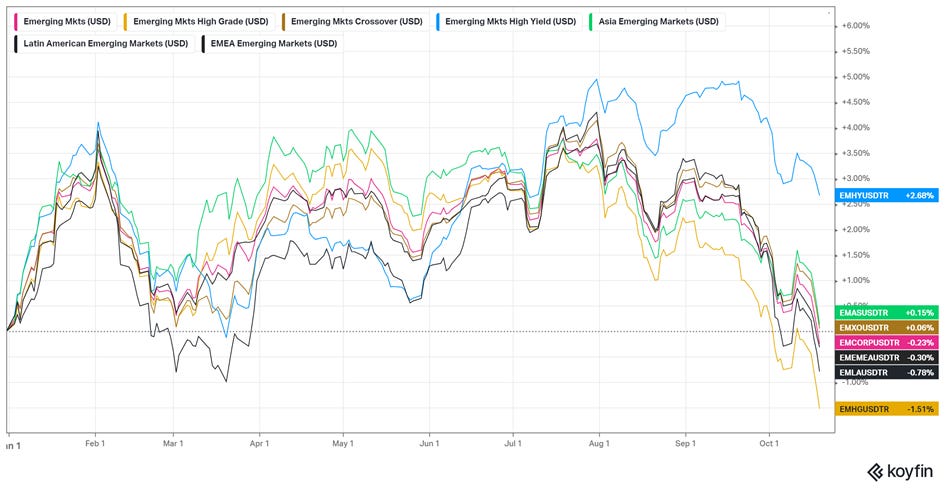
As we pointed out in our last conversation, in Emerging Markets when one would have expected that the relentless rise in US Treasuries yields would have crashed the Emerging Markets Fixed Income party à la 2013 taper tantrum, we have seen some weakness but far less than in US High Yield or US Investment Grade (YTD):
- Graph source Macronomics – KOYFIN
Here is the one month chart for Emerging Markets:
- Graph source Macronomics – KOYFIN
Credit risk wise 5 years CDS spreads are starting to rise (YTD chart). Since our last conversation US High Yield CDS gauge is wider by 40 bps. European High Yield as well is weakening:
- Graph source Macronomics – Datagrapple.com
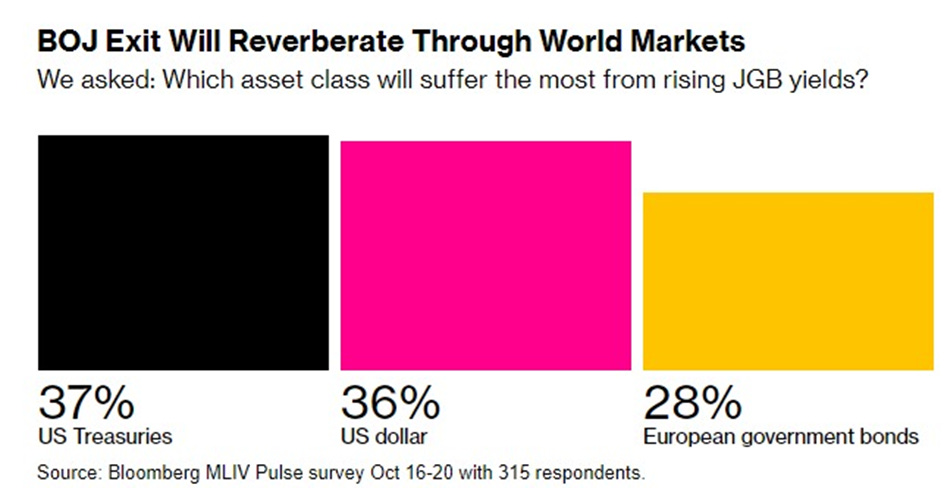
As you know we follow very closely the moves of the Bank of Japan which are paramount when it comes to risky assets. As per our August conversation this is what we had to say:
“The weakening of the Japanese yield is the consequence of significant amount of bonds purchase by the Bank of Japan. As we pointed out in our March conversation “The Cheshire Cat”, Japan already owned 56% of the Japanese government bond market and given their willingness in boosting their defense spending and that Japanese are reluctant to accept tax hikes, the easiest way of course is therefore to issue more bonds and for the Bank of Japan to buy more of it.” – Macronomics, August 2023
While financial pundits continue to drum up the “Chinese Lehman moment” narrative, like any good behavioral therapist we tend to focus on the process rather than on the content.
We have highlighted on many occasions that there has been a significant weakening of the Japanese yen in synch with the rise in US Treasury 10 year yields (6 months chart):
- Graph source Macronomics – TradingView
As such on our Twitter feed we recently joked and told our followers to print their T-shirt 5% yield on US 10 year and 150 USD/JPY. 6 months chart and we were kind of there on Monday morning with US Treasury touching 5% while Yen touched 150 yen in Asian trading time:
- Graph source Bloomberg
While everyone is looking at Chinese real estate woes, we prefer to focus our attention on Bondzilla which we mentioned on many of our musings. Why Bondzilla? Simply because the Fixed Income monster is “Made in Japan”:
- Graph source Bloomberg
Some financial pundits seem to get it. We keep repeating it, but, in terms of global asset allocations Japan matters and matters a lot!
Bank of Japan has made its fifth market intervention since July. On Tuesday, the Bank of Japan declared an unplanned bond operation in response to the surge in Japanese government bond (JGB) yields, which had recently reached a ten-year high. The Bank of Japan plans to buy 300 billion yen ($2 billion) in 5-10 year bonds and 100 billion yen in 10-25 year bonds starting Wednesday. Will the Bank of Japan tweak its Yield Curve Control (YCC) tool next week we wonder?
Moving to our next point, we look at BitCoin as a “liquidity” indicator. Back in 2022 there was a high correlation between BitCoin, ETH and the Nasdaq index leading to a significant sell-off in all three thanks to Fed’s aggressive hiking stance as per the below chart covering 2022:
- Graph source Macronomics – TradingView
YTD, while the performance of the NASDAQ can arguably been based on the AI revolution hype in general and NVDIA in particular, until June, both ETH and BTC were somewhat “lagging” but have jumped very significantly yesterday based on an ETF driven movement, on the anticipation surrounding ETF spot approval which propelled BTC around the $35K level, its highest level since May 2022. For BlackRock’s CEO Larry Fink this rally “is a flight to quality” beyond the ETF approval rumor:
- Graph source Macronomics – TradingView
The very recent jump in the price of BitCoin for us in conjunction with President Xi Jinping’s recent surprise visit to the People’s Bank (PBoC) makes us wonder if China is about to “unleash” a significant amount of additional stimulus as per our next point.
· Get to the chopper?
Being movie buff we could not resist to make this veiled reference to the “Predator” given everyone is running for the hills (or the chopper) when it comes to Chinese stocks in general and tech stocks in particular as reported in Asia Times article by William Pesek:
“Internet platforms in Hong Kong took blows, too, Gatley says, with Tencent and Alibaba each down 15% through August and September, despite strong earnings growth. And European luxury goods firms, which historically benefitted from affluent Chinese consumption and took a step up on the news of reopening, were also hit hard.” – William Pesek – Asia Times
Sure, we get the message from the foreigners (Macro tourists) offloading 24 billion yuan ($3.3 billion) of onshore stocks on a net basis this week:
- Graph source Bloomberg – X/Twitter
In regards to European luxury goods firms, which historically benefitted from affluent Chinese consumption taking the “proverbial” beating, as per our December conversation “Illusory trust effect” we recommended Hermès over LVMH in terms of “outperformance” for 2023 (YTD chart below):
- Graph source Macronomics - TradingView
During the course of 2021 we recommended OHM Research clients to be overweight on Hermès relative to LVMH (5 years chart):
- Graph source Macronomics – TradingView
Hermès is a “good business” in the sense that it has “pricing power”.
There is not a lot of price elasticity thanks to the “power of the brand” as pointed out by Rahul Sharma on our Twitter feed:
“Hermes hitting these numbers despite leather goods being sold almost entirely by appointment with 'display only' stock for walk-ins, as Hermès manages brand equity. Leather +73% on 4-year stack vs entire store +102%. Truly unique.
Hermes shows top tier luxury still hitting high notes. Despite Q3 headline slowing to 16% from 28% in Q2, 4-year growth stable at +102%. In geographies of recent concern, US stable QoQ at +100% vs 2019 & Europe accelerated to +57%.
Hermes YTD global sales +22%, with pricing +7%. So volume is incredible +15%. US outstanding, with only 3% pricing & 17% volume growth in sign top end spenders continue to splurge everywhere.” – Rahul Sharma
Hermès remains the most popular brand at auction according to Knight Frank Wealth Report on Luxury Investments. The power of the “brand” can be ascertained from the following article entitled “The Potential of the Investment Handbag”:
“The idea of using a handbag as an investment gained mainstream attention back in 2016 when Baghunter released a report that charted returns for Hermès’ Birkin bags from 1980 through the end of 2015 and compared them to returns derived from the S&P 500 and gold during the same 35-year period. Declaring Birkins a better bet than the two more traditional investment avenues, Baghunter found that while stock market gains and the value of gold are subject to “normal increases and decreases,” the value of Birkin bags only increased. In fact, the Beverly Hills, California-based luxury handbag reseller stated that the Hermès bags were continuing to grow in value – by an annual average of 14.2 percent. In other words, Birkins, which retail for upwards of $10,000 (subject to additional hoops/spending), do not have bad years, making them “the safest and least volatile investment market of the three,” per Baghunter.
Two years later, Jefferies analysts lent some credence to the notion of “investment” bags, citing the “strong secondary market” for certain items within the luxury sector, namely, Hermès’ most coveted handbags. In particular, the analysts cited the sale of “one Himalaya [Birkin bag] bought in 2010 for 29,600 euros, which was sold – as a pre-owned bag – six years later for 157,500 euros.” That represents a “432 percent upswing against about 310 percent if one had bought a Hermès share at the beginning of 2010 and sold it at the end of 2016.” – The Fashion Law
Of course, it represents a “low liquidity” market based but nonetheless interesting from a “brand management” perspective.
“Liquidity” always matter and the rule does also apply for “fine wine” (punt intended) and China but we ramble again:
“Among other financial indices, only one has performed worse than the Liv-ex Fine Wine 50 year-to-date: the Hang Seng, which has declined by 13.1%. The index entered bear-market territory in August after it dropped almost 21% from its high point reached in late January this year. This index has continued to slide after a bearish flag breakdown in early September, encountering resistance from a concurrent downtrend. The deterioration in its performance can be attributed to growing pessimism among investors regarding China’s post-pandemic recovery and concerns over the country’s debt levels and slumping property market.”
- Graph source Liv-ex – October 2023 – The fine wine market in Q3 2023
As well during our August conversation “Fortune cookie” we made a fun argument, where we argued that JP Morgan Senior CDS at 55bps was trading too tight relative to China (84 bps in August) given the most recent S&P multiple US Banks downgrades on growing liquidity worries as well as Fitch downgrading the United States of America’s rating. Now China 5 year CDS is trading around 86 bps, 2 bps wider since our last conversation whereas JP Morgan 5 year CDS is trading at 73 bps, 5 bps wider:
- Graph source Macronomics – Datagrapple.com
We still we continue to hear that China is facing a “Lehman” moment on growing real estate woes, outflows from equities and falling stock market:
- Graph source Bloomberg
We read that China's September power consumption rose 9.9% y/y to 781.1 billion kWh; Jan.-Sept. power consumption grows 5.6% y/y to 6.864 trillion kWh according to the National Energy Administration. Real estate woes remain a drag, but in our book power consumption is a good “proxy” indicator of “economic activity” rather than “speculative endeavors”.
In the four months from June the PBoC injected a sizeable RMB3.3 trillion (US$450 billion) into Chinese money markets and advanced a further RMB 2.1 trillion of medium-term loans. On top, in the past week alone they have injected another RMB2 trillion of new cash.
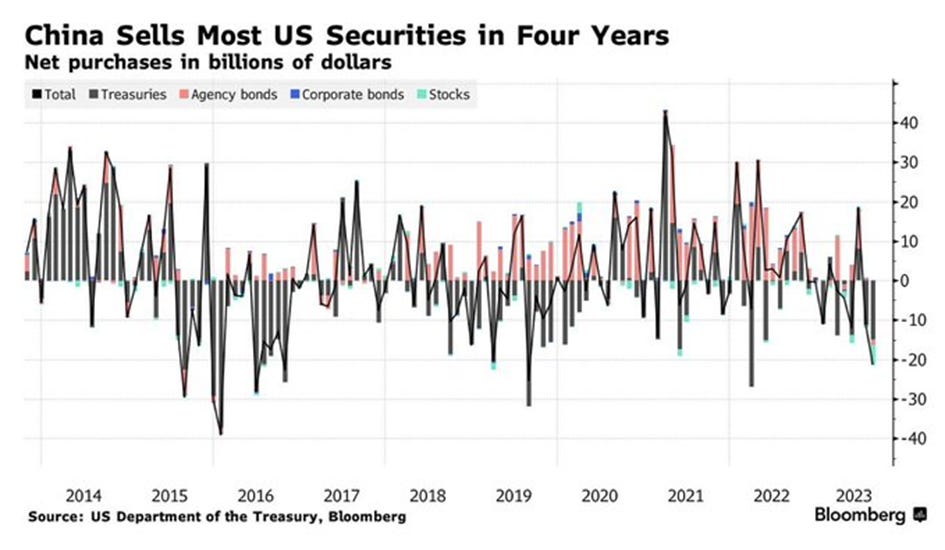
If foreign investors have been the ones dumping Chinese stocks, well China has been doing some dumping as well, but on US Treasuries that is:
- Graph source Bloomberg - Twitter/X
China has indeed cut its holdings in US Treasuries to $805bn, the lowest level since 2009. Beijing has been selling $502bn in Treasuries in the past decade, and of course the pace of Chinese selling has accelerated recently because after all as we pointed out with the help of our friend Geoffrey in our musings, its all about “Fiscal Dominance” issues, when it comes to the US budget deficit trajectory:
- Graph source Bloomberg
For those who know us by now, we like to be “contrarian”. For illustrative purposes in December 2020, we recommended clients on OHM Research to take a look at the neglected coal plays, and in particular troubled BTU which was trading around $5 at the time and as well dividend play ARLP (less volatile) also trading at around $5: ARLP is trading at $23 and BTU at $25 today:
- Graph source Macronomics - TradingView
The burst of the ESG bubble did the rest…
We believe that current “valuations” in the Chinese space are starting to be extremely compelling and Macro Research house we follow MRB has the following take on the matter:
“EM earnings will in any case likely be experiencing a significant recovery in the year ahead. China is clearly beating excessively bearish growth expectations, underpinning commodity exporters, while the tech exporting giants of Korea and Taiwan will experience a powerful earnings upturn supercharged by the semiconductor cycle. In the meantime, investment-led growth underpins solid Brazilian and Indian expansions.
Together with supportive EM central banks who will likely be cutting interest rates further, in sharp contrast with their DM peers, attractive valuations and washed-out investor positioning in EM stocks, the stars appear to be aligned for a period of solid EM equity outperformance over the next 6-12 months.” – MRB
Valuation wise we kind of like the following:
“When compared with DM peers, stocks in both EM ex-China and China are trading close to their lows since 2010, with discount of about 20% and 40% respectively on their 12-month forward P/E ratios. Even larger discounts to DM peers are apparent when looking through the prism of 12-month forward price-to-book (P/B) ratio. These are close to the largest discounts since 2010. For both EM ex-China and China, the 12-month forward P/B is close to its lows since 2010, at 1.7 and 1.3 respectively” – MRB
We have to admit that we would like to extend our gratitude for the pundits supporting the Chinese “Lehman narrative”. They have made us even more attracted to the low valuations we are starting to see amidst the carnage. We also agree again with MRB’s take on the matter we have to confide:
“At the root of this historical de-rating is negative foreign investor positioning in EM stocks. Foreign investors have been shedding China exposure since a brief wave of enthusiasm a year ago. There have been net monthly outflows from foreign-listed ETFs as well as via the StockConnect scheme since the end of August. This can perhaps be explained by the torrent of bearish commentary on China’s economy since early summer this year, with narratives highlighting an “imminent” recession, credit crunch and debt deflation. None of these scenarios played out, but foreign investors remain in a decidedly sour mood, justified by a self-reinforcing notion that geopolitical pressures have made China “uninvestable” for foreign investors. It will take time, and a lot of positive performance from the economy and, corporate earnings, plus the return of domestic investor enthusiasm, for stocks to break this bearish foreign narrative.” - MRB
GraphFinancials has a released a report and a valuation with recording in augmented media on Consumer Lending Company Lufax backed by Pin-An. The archives can be read as normal documents on pause but are explained with greater precision than a video on play (proprietary Tech GraphFinancials).
Here are the links. At the current price the dividend yield is 10% and discount to book around 85% yet the Company has turned the worst quarter of Q4 2022 (Covid Lockdown) and profits are up in Q2 vs Q1 profitable:
(should you want to subscribe to this service, you can use our discount code MNDOCUTALK).
We pointed out in our previous conversation that we have yet to see the end of the “bond revolution” so hence a continuation of our pre-revolutionary entitled musings.
How the Classical Economists can actually beat the moderns for Bonds Trading?
The idea that rates would rise for totally different reasons than a strong credit cycle was established by the Great Banking School writer Thomas Tooke in 1826. The higher rates reflect a deterioration or alteration of the value of money going forward as well as an immediate effect of a large supply of Government debt in connection to war spending:
“The proposition, then resolves itself into this. That the rate of interest, at any times, indicates the degree of expectation of profit: and then, as it is assumed that the expectations of those who borrow money, with a view to profitable employment, are likely, on an average, or in the long run, to be realized, the average of interest may be supposed to bear some proportion to the rate of profit. Thus, on average of some indefinite number of years, sufficient to equalize the effects of seasons, political and commercial changes, alterations in the value of money, and every source of miscalculation, the customary rate of interest might be assumed to bear some proportion to the rate of profit.
A state of war, on the other hand, may easily be supposed to raise the rate of interest by creating a supply of that description of security to a larger amount, and more rapidly, than could be absorbed by the accumulation of the class coming under this head. A rise in the rate of interest is, therefore, a condition for obtaining the requisite funds from the other classes of persons possessing monied capital.
Hence it may be seen why the rate of interest, as measured by securities involving no risk or trouble, should be lower in peace than in war, without resorting to any difference in the rate of profits, to account for that difference in the rate of interest.” - Thomas Tooke
No wonder the most recent US 30 years bond auction did not go that well. Another case of the ongoing revolt from the “bonds vigilantes”? We wonder.
With Geoffrey’s help, we endeavor to touch more on various subjects through GRAPHFINANCIALS
“Buy on the cannons, sell on the trumpets”?
You can join Macroeconomics on our Telegram Channel indicated in our Twitter profile as well you can join our Twitter feed. Going forward we will publish more frequently on our dedicated Substack page.
PERSONAL COMMENTS ON MACRO TRENDS, MACRO NEWS AND VIEWS. ALL RIGHTS RESERVED. DISCLAIMER: INFORMATION PROVIDED ON THIS BLOG DOES NOT CONSTITUTE A RECOMMENDATION OR ADVICE TO PURCHASE ANY INVESTMENT, PRODUCT OR SERVICE LISTED OR MENTIONED ON THIS BLOG. INFORMATION DISPLAYED ON THIS BLOG IS NOT INTENDED AS SPECIFIC INVESTMENT ADVICE AND SHOULD NOT BE RELIED ON FOR MAKING INVESTMENT DECISIONS.
Macronomics Newsletter is a reader-supported publication. To receive new posts and support my work, consider becoming a free or paid subscriber.
Martin - Always excellent and actionable. Tooke is apropos - Silent enim leges inter arma. Of course the "springtime" could be of this nature... https://youtu.be/vRRDWzvVlz4?


Martin - Always excellent and actionable. Tooke is apropos - Silent enim leges inter arma. Of course the "springtime" could be of this nature... https://youtu.be/vRRDWzvVlz4?