Looking at the convolutions relating to the US debt ceiling negotiations, when it came to decide what should be our analogy title we decided to go for “Willful blindness”. “Willful blindness”, also known as conscious avoidance, is a judicially-made doctrine that expands the definition of knowledge to include closing one's eyes to the high probability a fact exists. Deliberate indifference and contrived ignorance also are used to describe the phenomenon. Unfortunately, there is a great deal of willful blindness in our world today. Willful blindness can cause the downfall of an organization's leadership and culture. Although the term was originally and still is used in legal contexts, the phrase "willful ignorance" has come to mean any situation in which people intentionally turn their attention away from an ethical problem that is believed to be important by those using the phrase for instance, because the problem is too disturbing for people to want it dominating their thoughts, or from the knowledge that solving the problem would require extensive effort such as reducing significantly the US budget deficit but we ramble again.
In this conversation, we would like to discuss again prospects for Emerging Markets and commodities in continuation for our November 2022 conversation entitled “The Scarcity Principle” as well as market prospects in the light of the most recent decline in the US CPI to 4%.
Macronomics Newsletter is a reader-supported publication. To receive new posts and support my work, consider becoming a free or paid subscriber.
· You can’t always get what you want
As we pointed out in our November 2022 conversation “The Scarcity Principle”, when it comes to scarcity and economic principle, there is not enough of some strategic material to fully satisfy those who want it, which indeed explains a lot when it comes to geopolitics. There is always more than meet the eye when it comes to the art of “diplomacy” and strategic resources. As well in our April conversation “Let Them Eat Cake”, we argued that the S&P was a sectorial bet, whereas MSCI EMs returns are dominated by old economy industries, commodity and more generally stuff-producing companies. EM, therefore being a bet on scarcity and inflation.
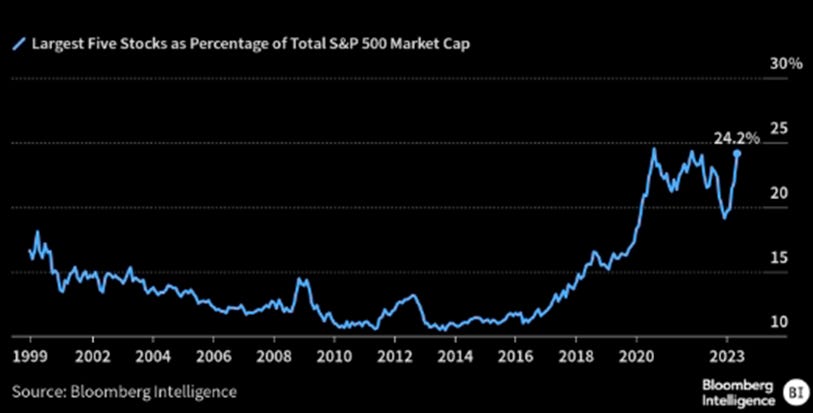
When one look at the significant rally in Tech related stocks relative to the Energy sector, one could opine that the “great rotation” of 2022 has indeed been reversing given the significant rally witnessed so far in the sector but mostly due to the largest five stocks as a percentage of Total S&P500 Market Cap:
- Graph source Bloomberg
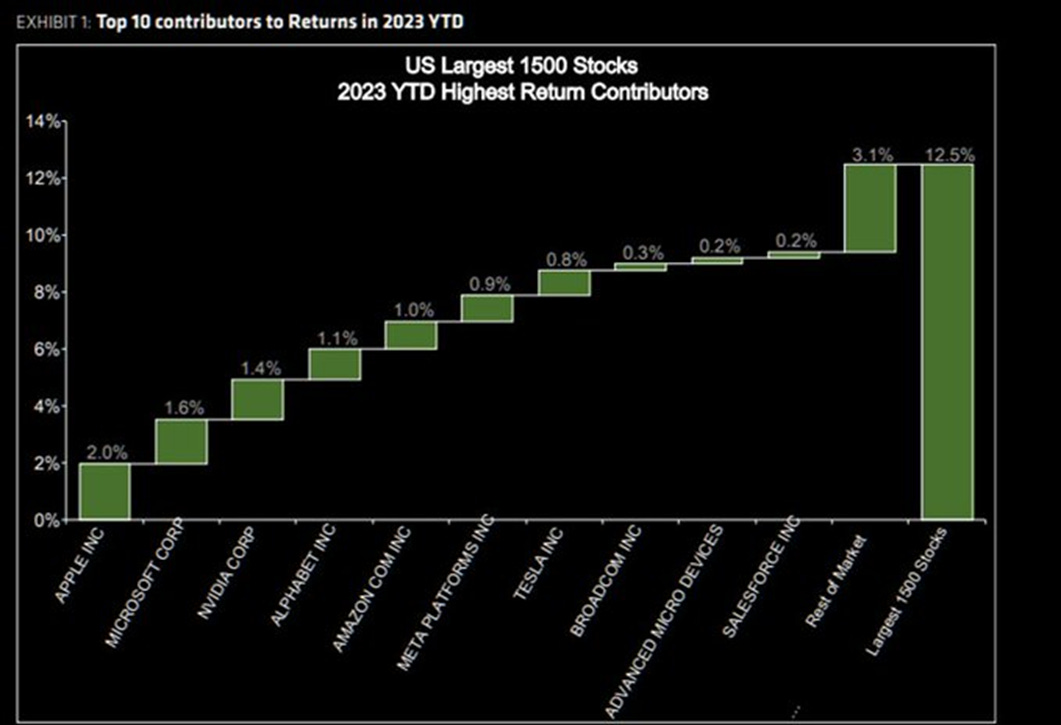
As pointed out by @N013Q on our Twitter feed:
“This year, 10 stocks made up 90% of the Index's 13.0% gain. The contribution from the top 10 stocks to the total index performance is the highest in 40+ years for the first half of 2023. The 1H 2023 market rally relied mainly on multiple expansion, not earnings growth. Despite returns slightly below historical averages, the top 10 contributing stocks underperformed in the following 6 and 12-month periods, prompting investor concern.”
- Graph source @N013Q – Twitter
Some like Morgan Stanley are telling us that this is a bear market rally and that it has legs:
- Graph source Bloomberg – Twitter
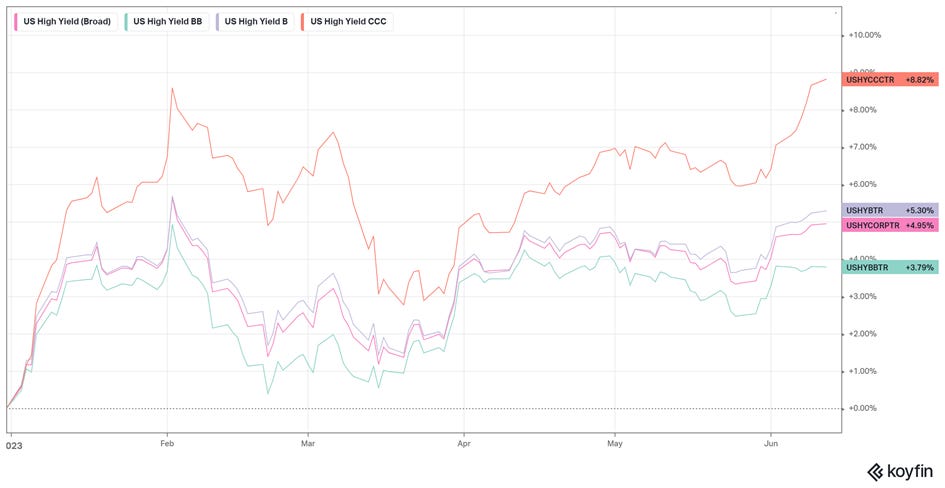
We do agree that given the ongoing trajectory of credit markets, for now we do not see a catalyst for a sell-off unless of an exogenous factor from a geopolitical event as per the below performance YTD from US High Yield in general and the CCCs bucket in particular:
- Graph source Macronomics - KOYFIN
What we also find of interest from our previous commodities and ESG musings such as our December conversation “Illusory trust effect” has been around the issues in sourcing enough copper, lithium or cobalt around. The ongoing rapid geopolitical shifts following the war in Ukraine are also leading to frantic “diplomatic activity” to secure access to raw materials. We argued at the time:
“If “deglobalization” is the “trade du jour”, the trade of tomorrow might be more “resource nationalism” meaning potentially more “exports ban” going forward. You have been warned.” – Macronomics, December 2022
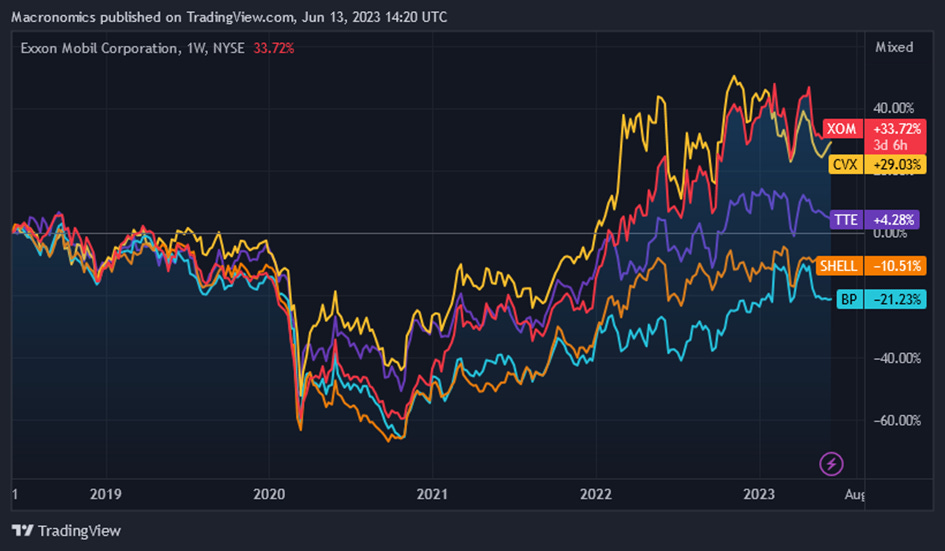
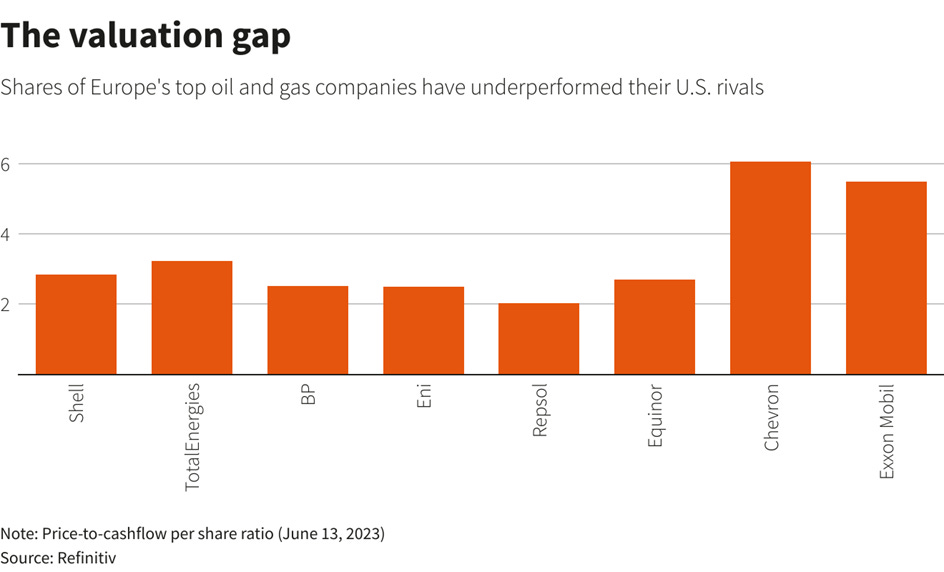
Relating to ESG, we are not surprised by the underperformance of ESG heavy oil majors (BP, SHELL, TOTAL ENERGIES) relative to EXXON (XOM) and CHEVRON (CVX) over 5 years as per below chart:
- Graph source Macronomics - TradingView
Back in February 2022 we agreed with the following comment from Gochrings & Rozencwajg:
“BP already has a sub-standard return on assets compared with its peers. If they continue with their ambitious renewable plans, their profitability will likely deteriorate significantly from here. BP is a prime example of how renewables impact a company’s profitability. Exxon, Chevron, and Shell should all take notice. An activist shareholder has called for Shell to reduce upstream capital spending further and divert the investment into renewables.
Somehow, after nearly three years of oil market tightness and two years of strong equity performance, investors still refuse to allocate capital to the space. Over the last two years, energy has outperformed any other sector in the S&P 500 by 130 percentage points and the index by 150 percentage points. And yet, energy still represents less than 5% of the S&P500’s market capitalization – less than half its long-term average and 65% below the 2008 peak.
Pundits argue subsidies will help accelerate the transition from hydrocarbons; we remain skeptical. Throughout human history, society has willingly shifted away from one form of energy towards another only when it has been economically advantageous. Before Colonel Drake drilled the first oil well in 1859, whale oil was a dominant fuel source. In 1840, the US consumed 1.6 PJ of whale oil, equivalent to 710 barrels of crude oil equivalent per day. By 1870, whale oil consumption had fallen 75% to only 175 barrels of oil equivalent per day, while crude demand surged from nothing to 14,000 barrels per day. The economics of drilling and burning crude oil justified the transition. Society did not rely upon subsidies. Instead, economics and energy return on investment (EROI) drove the adoption. Our research shows that fully buffered renewable power has a much lower EROI than natural gas. By massively incentivizing the widespread installation of such an inferior energy source, the Inflation Reduction Act will ultimately usher in an energy crisis of unprecedented magnitude.
Many analysts quickly point out that the cost of wind and solar have fallen by 80-90% over the past decade. They argue that these massive cost reductions are evidence of a sharp “learning curve.” As the industry installs more renewable power, they claim, efficiencies grow, and costs fall. According to this logic, governments should heavily subsidize early renewable capacity to reduce costs and fast-track adoption.
Unfortunately, our research suggests that this strategy relies upon a faulty assumption. Over the past decade, most of the cost savings have come from cheap capital and energy costs and not dramatically improved manufacturing efficiency.
We estimate that over the next 15 years, the Inflation Reduction Act’s investment and production tax credits could total over $1.5 trillion. Unfortunately, we expect much less energy will be available in the US. Consider the following. If you believe we are now in an energy-insecure world, there are two available power technologies: natural gas or coal and renewables. The former enjoys an EROI of 30:1, while the latter has an EROI of ~5:1. The IRA has now guaranteed that investors will divert capital from traditional energy to renewable power. We believe the net result will, of course, be much less available energy, severely limiting economic growth" - Gochrings & Rozencwajg - Natural Resource Market Commentary
As a reminder BP was one of the first oil and gas giants to announce its ambition to cut emissions to net zero by 2050. It also had previously promised that emissions would be 35-40% lower by the end of this decade. However, on in February it said it was now targeting a 20-30% cut, saying it needed to keep investing in oil and gas to meet current demands. The reality as far as we are concerned is that the heavy investments from this oil major has led to severe stock underperformance relative to its US peers less committed to ESG. It is not only “underperformer” BP which has thrown the proverbial “renewables towel” but most recently Shell as well as reported by Reuters on the 9th of June in their article entitled “Shell pivots back to oil to win over investors”:
“The shift away from further cuts in oil production at Shell is similar to a move by rival BP (BP.L) made earlier this year when CEO Bernard Looney rowed back from plans to cut its oil and gas output by 40% by the end of the decade.
Returns from oil and gas typically range between 10% to %20, while those for solar and wind projects tend to be between 5% to 8%, according to companies and analysts.
Sawan told investors at Shell's annual general meeting in London last month that "significant investments in oil and gas are needed just to keep production at a constant level, let alone to meet growing demand."
Around two-thirds of Shell's $25 billion spending last year went towards oil and gas, while the company invested $4.3 billion in renewables, biofuels, hydrogen and electric vehicle charging.”
– Source Reuters
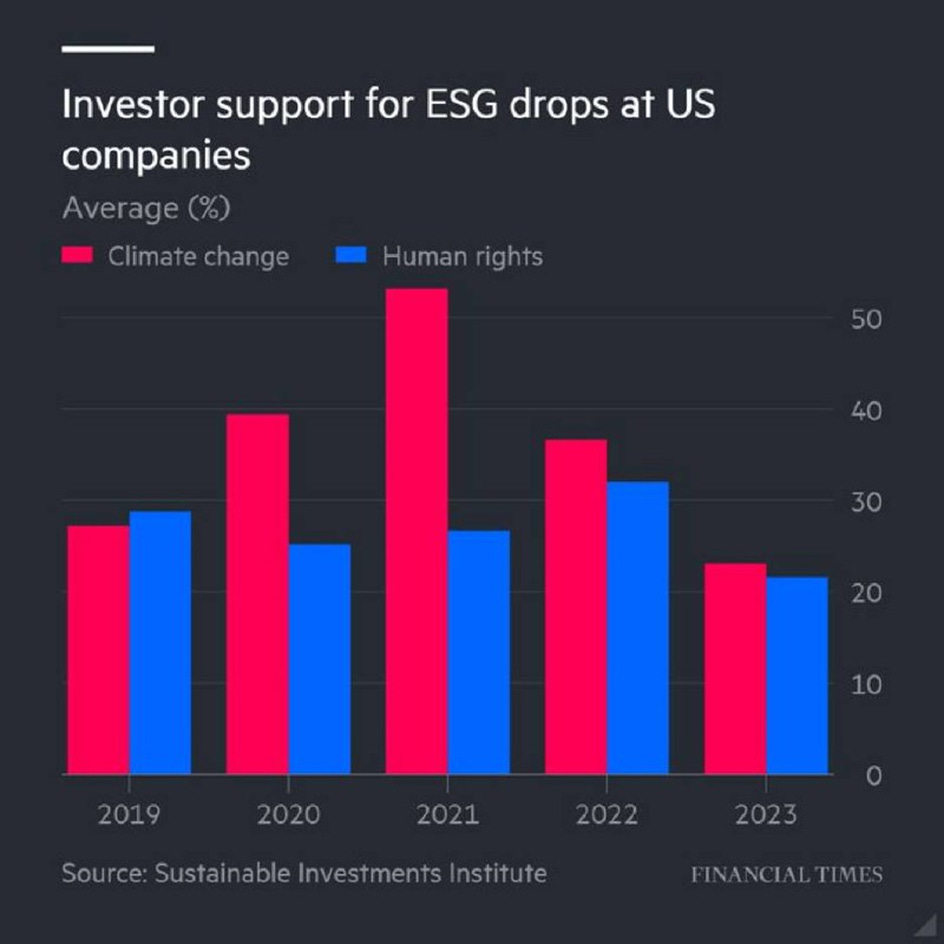
We also believe that gradually the ESG much vaunted “miracle” is fading as hard reality sets in. Also, one needs to take into account the “repricing” of “renewables” due to the new “reality” of interest rates levels but we digress:
- Graph source Financial Times – Twitter
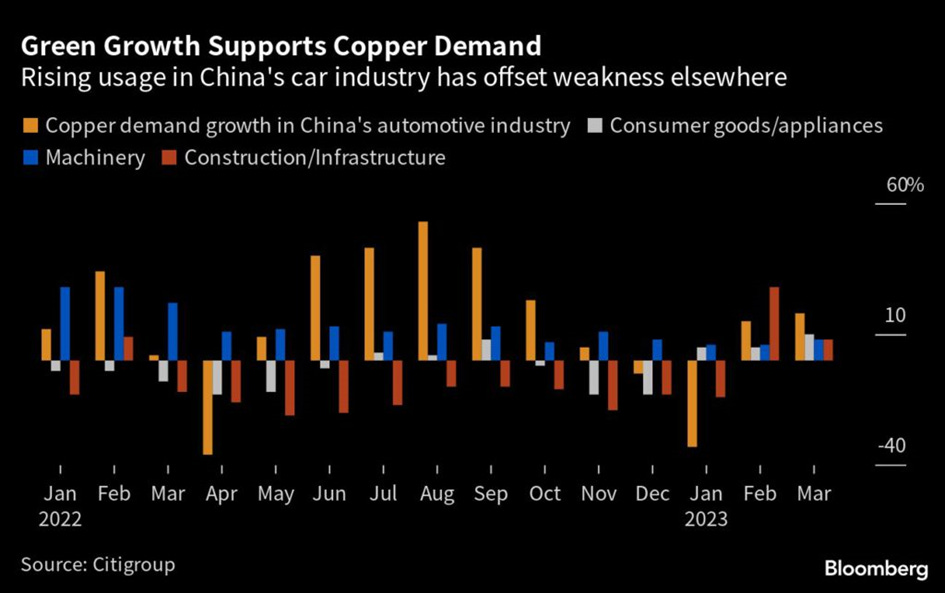
When it comes to scarcity, we would like again to point out to copper given that major discoveries are becoming more “scarce”:
“The key industrial metal is widely known as a proxy for global economic activity, and prices have slumped in recent months on weakening demand from traditional sectors like construction and consumer goods. Even staunch copper bulls like Goldman Sachs Group Inc. have been pulling in their horns, saying they were wrong in predicting sharp gains in prices this year.
But copper is fast emerging as the go-to commodity for investors looking for exposure to the energy transition, and they’re likely to pile in quickly as soon as the gloomy global growth outlook starts to improve, Max Layton, Citi’s managing director for commodities research, said in an interview.
That will set the stage for a buying frenzy as orders from car-makers and grid operators flood in. The bank predicts that rising allocations from index-tracking investors and hedge funds could help boost net bullish positioning in the copper market to about 4 million tons by 2025, a sharp reversal of current bearish sentiment. That would be equal to about a fifth of global supply and double a prior peak seen in 2021.
As usage starts to soar, rising hedging activity from car-makers could add a further 1 million tons in long positions, bringing a wall of money into the futures markets just as demand starts to race ahead of supply in the physical industry. That will help push copper to a record high, Citi said.
“If you want to put on a decarbonization trade in commodities, the only truly liquid commodity is copper, and it’s the most liquid by a country mile,” Layton said by phone from London. “Copper’s unique characteristics mean that it could make oil’s 2008 bull run look like child’s play.” – Bloomberg news – Mining.com
- Graph source Bloomberg
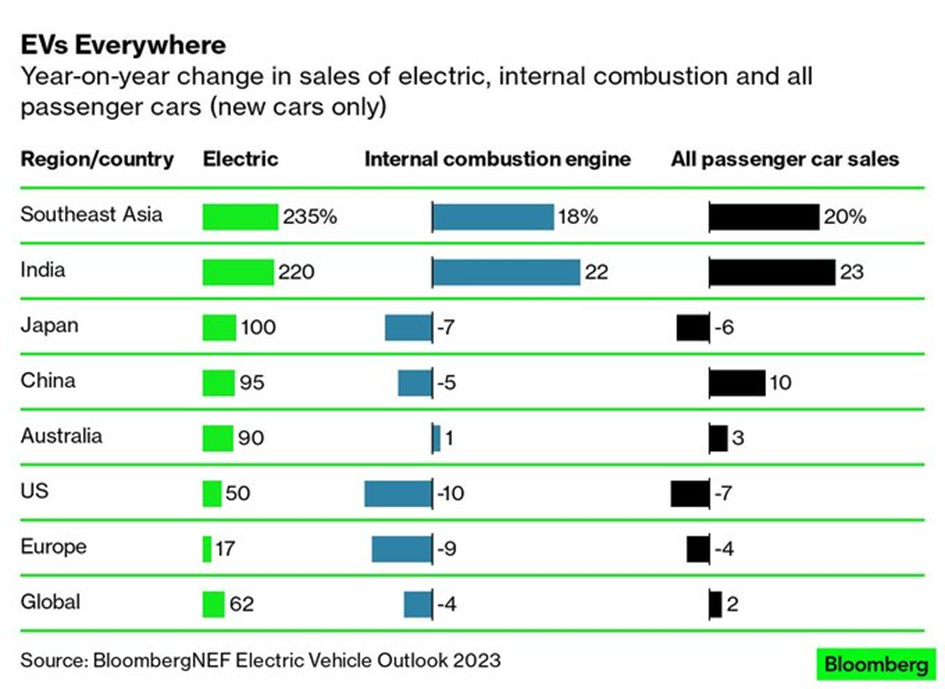
If indeed from a “macro” perspective, Europe is slowing and Germany is in “recession”, the strongest rise in demand for EVs is coming from Southeast Asia and India as per the below chart from Bloomberg:
- Graph source Bloomberg
Also note that when it comes to “transitioning”, demand for internal combustion engine remains strong in the Eastern part of the world relative to the United States and Europe. Sure, global demand is slowing for internal combustion engine, but, given the demand dynamics, industrial metals, such as copper and silver and lithium, continues to play a significant part in the EV equation hence the global race to “secure” resources we think.
- Graph source Bloomberg – Twitter
For those of you who have been great at deciphering our musings you know about our “contrarian” stance and “hints” (such as the one we gave on the luxury sector on China re-opening theme back in November last year). We like more and more the fact that the energy sector is currently being “neglected” flow wise. For us it is indicative that it is getting cheap and therefore “enticing” as per below cumulative fund flows from Deutsche Bank:
- Graph source The Daily Shot – Deutsche Bank - Twitter
“Fund managers have cut commodities allocations to their lowest levels for three years in a shift that illustrates declining confidence in the outlook for Chinese demand for raw materials and fears that the global economy will enter recession.
Bank of America’s monthly global fund manager survey showed that a net 3 per cent of managers held an “underweight” position in commodities in May after canvassing the views of 247 institutional investors that together oversee $708bn of assets.
Investor sentiment towards commodities has weakened markedly, dropping 17 percentage points over the past two months, the steepest deterioration since August 2015, according to BofA.
Most major commodity prices, apart from gold, sugar and beef, have fallen over the past 12 months. The S&P Goldman Sachs Commodity total return index, the most widely followed commodities benchmark, has dropped 27 per cent since reaching a near eight-year high in June 2022” – source Financial Times, 13th of June 2023
Investors are indeed “retreating” at the very moment when China is starting again “stimulating” and cuts interest rate on standing lending facility by 10bps. Given according to Bank of America most recent investors survey being short China equities is in June 2023 the second most crowded trade after being long Big Tech, we kind of like this set up which brings us to our second part.
· What’s in the cookie jar?
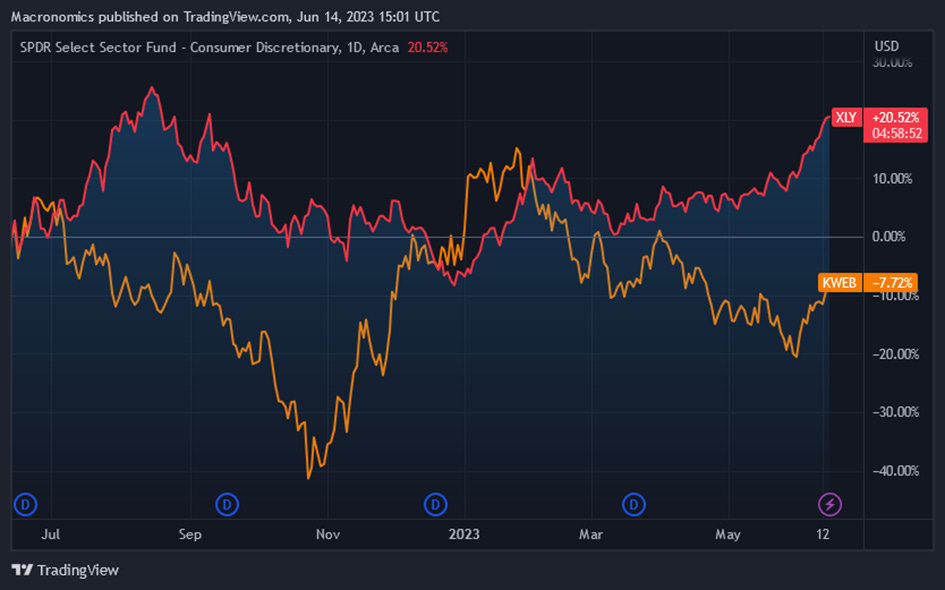
From a contrarian perspective we think that the US rally in TECH has been breath taking, and given Chinese Tech has been more volatile as per below chart, we think, that given the consensus trade has been being short Chinese equities and that China is starting to “stimulate” again, we think Chinese TECH is cheap:
- Graph source Macronomics – TradingView
Also we are already seeing the beginning from some mainland investors at least on Hong Kong shares which have been disappointing YTD down by 1.7%:
- Graph source Bloomberg
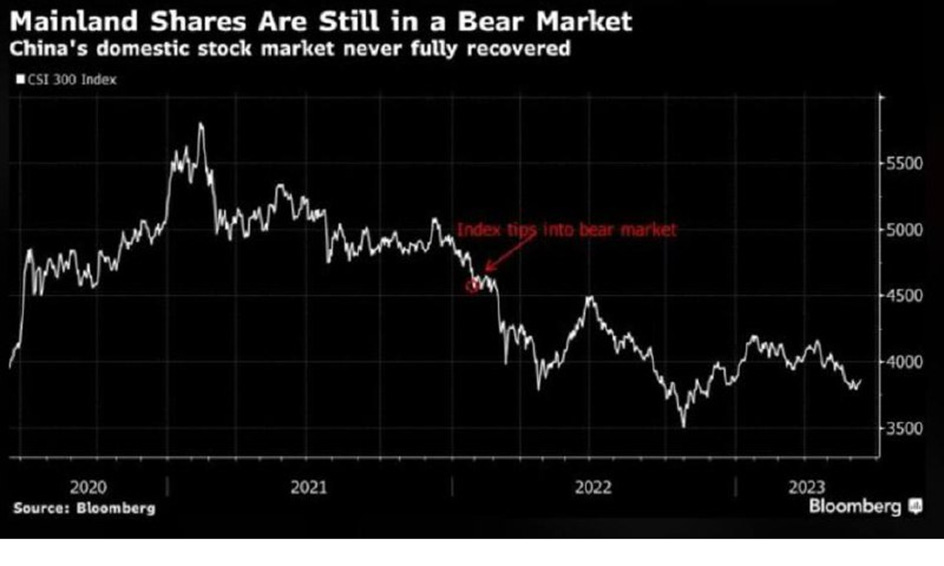
As well, Mainland domestic Chinese shares have continued to be underwater:
- Graph source Bloomberg
As you know by now we like what is “cheap” as such some Chinese TECH story such as Alibaba (BABA) looks more and more enticing from a “cookie jar” perspective (5 years chart below):
- Graph source Macronomics – TradingView
Alibaba stock is “cheap” on a relative basis trading with a 21 PE. Sure Chinese much vaunted “recovery” story has been disappointed for some but we think the name has more upside relative to where US TECH is trading. Sure we could delve more into the reasons behind our take on the name, but our blog mostly deals with “Macro”, not in “stock picking” per se anyway.
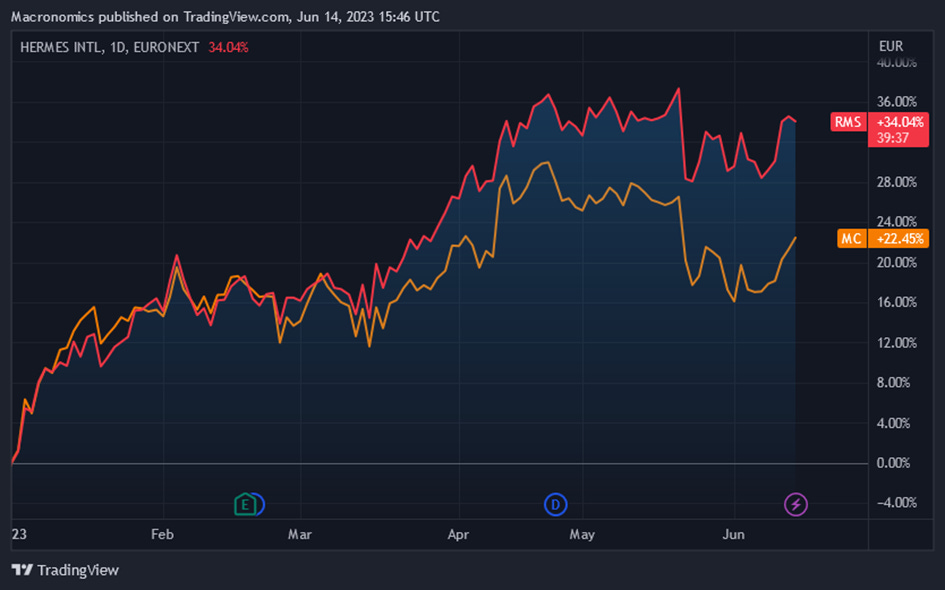
Back in November last year we hinted that the Chinese “recovery” story would favor the French luxury sector and as such there have been a significant bounce in the sector which is a significant weight in the European Consumer Discretionary sector. We also pointed out in our December conversation “Illusory trust effect” that French luxury house Hermès has a stronger margin than LVMH and continues to have our preference (Hermès vs LVMH YTD below chart):
- Graph source Macronomics – TradingView
In this prior conversation in December 2022 we told you that in 2023 Hermès would continue to outperform LVMH in 2023, so far this year we continue to be vindicated by our relative view on the name thanks to Chinese buyers. As we discussed in January in our conversation “The Year of The Rabbit”, the luxury sector represents more than a third of the weight of the CAC 40 (LVMH + L’Oréal + Hermès + Kering). The weight of the luxury sector in the French sector has tripled since 2007. The CAC 40 is not a true reflection of the French economy as such given some sectors such as the luxury sector are over-represented. In the US, the Tech sector as well is over-represented in some indices.
Since the beginning of the year, credit risk (CDS spreads) has been steadily falling, pointing towards a “risk-on” environment hence the rally in “high beta”.
Both the US 10 years yield and the USD/JPY have moved in lockstep during the course of 2022 and continue to move in synch:
- Graph source Macronomics - TradingView
For us and in continuation to our most recent conversation, Bank of Japan’s change in its monetary stance and the allocation from Japanese Lifers in the Fixed Income space are of paramount importance. Life insurance companies and pension funds have been positioning for an end of Bank of Japan ultra-loose YCC policy (yield-curve control). They have switched from loss-making off-shore bond holdings towards yen holdings waiting for Japanese bond yields to rise. Most players are confident the Bank of Japan next Friday will remain ultra easy despite rising inflationary pressure. A weaker yen is making hedging costs on US Treasuries and foreign bonds an expensive bet. According to Reuters, Insurance companies have sold 1.47 trillion yen ($10.50 billion) worth of foreign bonds so far this year. On Friday Japanese investors expect the 10 year JGB yield band to be increased from 50 bps to 75 bps and short term policy rate to rise by a paltry +0.1% from -0.1% in the first quarter of 2024. Everyone is indeed waiting for Bank of Japan Governor Kazuo Ueda. Why does it matter? Because the Japanese yen remains the most attractive funding currency for all the carry players of the world!
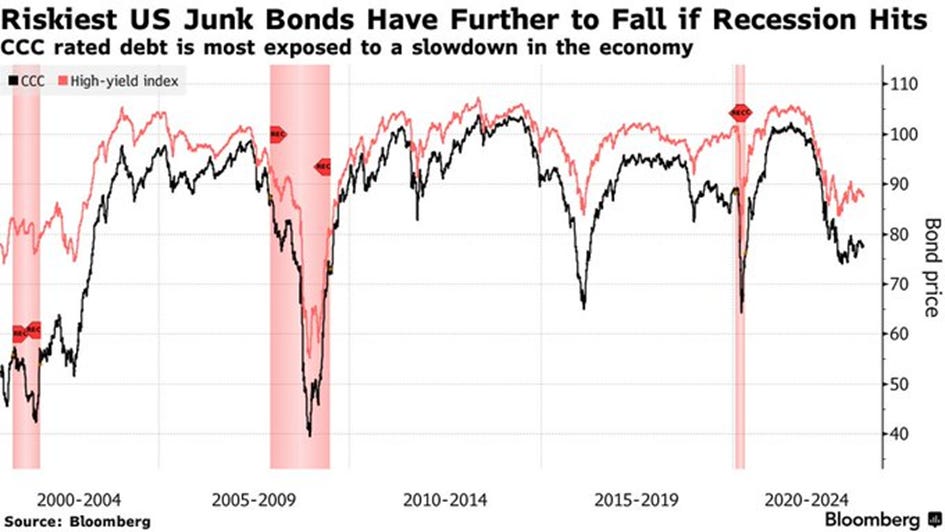
On a final note, while we pointed out in our last conversation of the weaker tone in the most recent Fed Senior Loan Officer Opinion Survey (SLOOs), when it comes to credit markets, credit spreads are yet to indicate at least in the high beta space (CCCs) an end to the “risk-on” environment prevailing but there as we said earlier on, there is always a looming exogenous factor from a geopolitical stand point that can rock the boat:
- Graph source Bloomberg
“He who learns but does not think, is lost! He who thinks but does not learn is in great danger.” - Confucius
You can join Macronomics on our Telegram Channel indicated in our Twitter profile as well you can join our Twitter feed. Going forward we will publish more frequently on our dedicated Substack page.
PERSONAL COMMENTS ON MACRO TRENDS, MACRO NEWS AND VIEWS. ALL RIGHTS RESERVED. DISCLAIMER: INFORMATION PROVIDED ON THIS BLOG DOES NOT CONSTITUTE A RECOMMENDATION OR ADVICE TO PURCHASE ANY INVESTMENT, PRODUCT OR SERVICE LISTED OR MENTIONED ON THIS BLOG. INFORMATION DISPLAYED ON THIS BLOG IS NOT INTENDED AS SPECIFIC INVESTMENT ADVICE AND SHOULD NOT BE RELIED ON FOR MAKING INVESTMENT DECISIONS.
Macronomics Newsletter is a reader-supported publication. To receive new posts and support my work, consider becoming a free or paid subscriber.


Martin- As always actionable and excellent mon ami.